

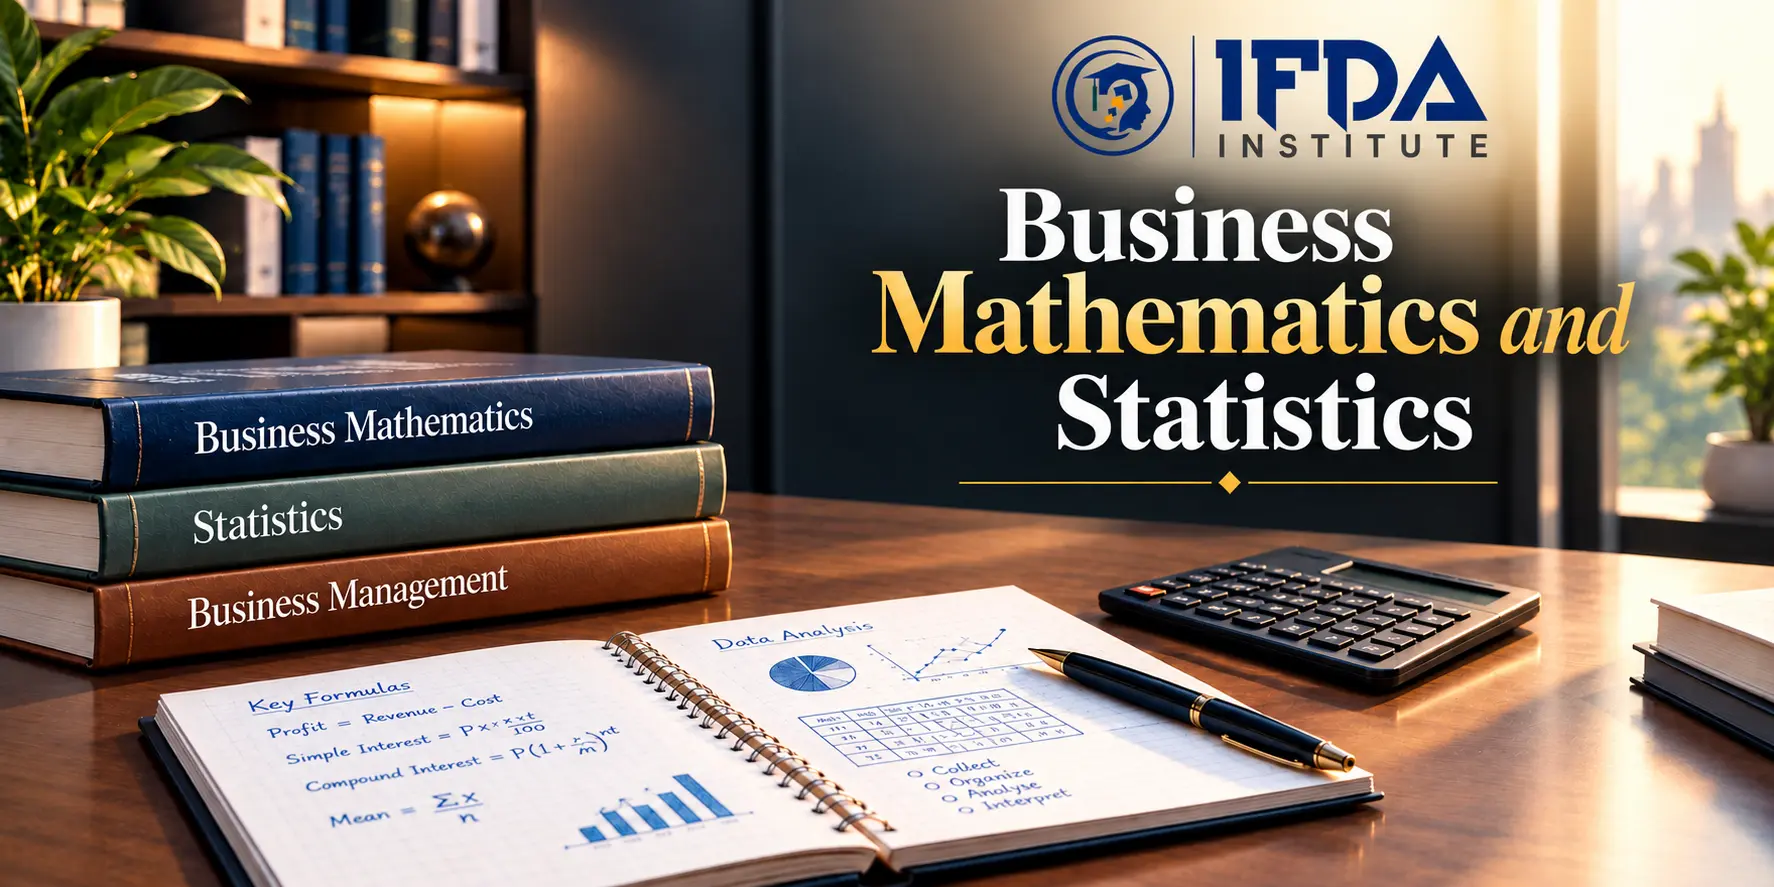
Business Mathematics and Statistics play a vital role in providing students with knowledge about data and its implications in business decision-making. A business organisation deals with a lot of transactions on a daily basis, including sales, expenses, profits, investments, and savings. It becomes necessary for organisations to make sense of such data in order to make informed decisions.
Business Mathematics and Statistics involve the study of mathematical concepts and statistical data in order to analyse business decisions and economic forces. Commerce students must learn these subjects in order to gain a clear understanding of a business organisation and its working.
Importance of Business Mathematics
Mathematics plays an important role in the field of commerce. In order to run any business, it is necessary to calculate profits and savings. Calculating selling price, discount, profit or loss, and budgets require a clear understanding of mathematics and its concepts. For example, a retailer purchases goods from a wholesaler for ₹20,000 and sells them to consumers for ₹25,000. This implies that the retailer gains Rs. 5,000 as a profit. Students of commerce can use mathematics to understand concepts, such as, profit and loss, and its calculations. Mathematics has applications in almost all fields, including accounting, banking, economics, and finance.
Major Concepts Covered in Business Mathematics
Percentages, Ratios and Proportions
Percentages are used in businesses to denote discounts, profit rates, price increases or decreases, and sales growth. Ratios indicate the number of one quantity relative to another, while proportions are two ratios equal to each other. All the three concepts can be applied in numerous ways in business, for example, to calculate and analyze financial statements, inventory, and planning.
For example, during sales, if sales proceeds increase from Rs. 50,000 to Rs. 60,000, this is an increase of Rs. 10,000 or 20%. These concepts are helpful to students in understanding the basics of percentages, ratios, and proportions and to apply them in calculations.
Profit, Loss and Interest Calculations
Profit and loss calculations are crucial for businesses to understand if they are making a profit or experiencing losses by comparing the cost and the selling price. Students studying this topic can learn how to calculate the cost price, selling price, profit percentage, and loss. In addition, they learn simple and compound interest calculations, which are important concepts in finance.
Simple interest is calculated only on the principal amount, unlike compound interest, which is calculated on the total amount including the accumulated interest. By learning about simple and compound interest, students understand the basics of credit and financial calculations.
Break-Even Analysis
Break-even analysis is used in businesses to calculate the amount of sales needed to ensure that total revenues and total costs are equal, which means that the company has zero profit or loss.
The concept helps students understand the relationship between costs, price, and volume and how each of these factors affects the company’s profit. In addition, they can also analyze what will happen to their business if sales volume changes. Thus, break-even analysis also helps students learn the fundamentals of financial planning and management.
Introduction to Statistics in Business
Statistics is a broad term that refers to many techniques used to gather, organize, present and analyze information. Businesses generate copious amounts of information on a daily basis, from customer interaction, market research, sales records and other operations. Statistics helps in utilizing this information by providing methods to analyze and draw conclusions from data.
For instance, businesses could use statistics to analyze patterns in customer sales behavior over time and identify trends. Interpreting this information enables the owners to understand and predict business needs based on the sales information. Statistics has wide application in business studies including marketing surveys, financial analysis, economics, accounting and research studies.
Measures of Central Tendency
The mean, median and mode are measures of central tendency that mainly involve the use of averages. The mean is obtained by dividing the total sum of the set of observations by the total number of observations. The median on the other hand is the middlemost value of observations arranged in order. Finally, the mode is the value that appears most frequently in a set of observations.
Each of these measures of central tendency help students to understand more about a data set. For instance, the mean is used in determining the average daily sales of a business to make predictions about future sales. However, it is important to determine which of the measures of central tendency is most appropriate when analyzing a data set especially where extreme values may distort the results.
Understanding Dispersion and Probability
Dispersion analysis helps to reveal how much observations vary from the central tendency. This includes measures such as range, variance and standard deviation. Businesses apply dispersion to predict future activity levels based on the average performance. Similarly, two businesses in the same line of trade may have different average sales volumes and dispersion helps to determine this level of difference.
Probability is also applied in the determination of the likelihood of an event occurring. In business, for instance, probability is crucial in decision making such as predicting market trends and customer behavior. However, since probability does not predict future events with absolute accuracy, it may only be used to describe possible scenarios and not certain outcomes.
Data Collection and Presentation
Statistical data analysis begins with collecting appropriate information and organizing it according to specific objectives. There are different techniques of collecting data including surveys, interviews, observation and reviewing existing resources. Once data has been collected, it needs to be presented in a format that is easy to comprehend.
The use of tables, charts and graphs is effective in this stage of data analysis. For instance, bar graphs are convenient for comparing different sets of data while line graphs help to highlight trends in the data set. Presenting information in graphs enables students to highlight salient aspects of the data set under review and avoid misinterpretation of results. Thus students need to clearly present information and state the meaning of the results they have arrived at.
Applications in Modern Business Management
Business Mathematics and Statistics are interdisciplinary subjects with overlapping fields of application. The two subjects are essential in business finance and management where mathematics is used to track income and expenses and statistical techniques are applied to evaluate financial trends. Mathematics is also used extensively in marketing to analyze and predict economic trends while statistics helps in carrying out survey research to understand market preferences. Additionally, these two subjects form the basis of data analytics and students need to master them to pursue a career in data science. Thus, students need to engage in such activities as analyzing equations, working out mathematical problems using spreadsheet instructions and analyzing simple business reports.
How Students Can Improve Their Understanding
Students should develop an understanding of concepts rather than rote learning of formulas and rules. In addition, regular practice will help them identify patterns in questions, improve their calculation speed and accuracy, and instill confidence in solving numerical problems.
Preparing a formula notebook, thoroughly studying the topics that need more practice, and regularly working on previous year’s question papers are a few ways through which one can prepare better for exams. For Statistics, practising with small datasets and calculating the mean, graphs, and other measures will help better understand the concepts. Moreover, relating the mathematical concepts to real-life business problems will demonstrate how statistics can be applied in different fields.
Conclusion
Business Mathematics and Statistics equip students with basic knowledge of the mathematical principles needed to understand financial calculations, analyse data, and make better business decisions. Mathematics helps in solving various numerical problems, whereas Statistics provides an insight into analyzing and interpreting data trends. Therefore, a clear understanding of Mathematics and Statistics is fundamental to decision-making in different business areas, including accountancy, finance, economics, and management. Additionally, conceptual knowledge of Mathematics and Statistics will facilitate higher studies and research in various fields, such as analytics and data science.
Ready to Take the Next Step in Your Career?
Explore IFDA Institute courses and build the skills you need for your creative and professional career.